Reading a match through its numbers: xG, field tilt and PPDA
Three numbers that tell you more than the scoreline: expected goals, field tilt and PPDA. What each one measures, how to read them together, and where they fall short.
By Niamh Doherty 7 min read
Key facts
- Topic
- Match breakdowns
- Written by
- Niamh Doherty
- Published
- Reading time
- 7 minutes
In short
- Expected goals (xG) rates how likely a shot is to be scored, based on similar shots in the past.
- Shot quality matters more than shot count: a few close-range chances can outweigh many long-range efforts.
- Field tilt is each team's share of the passes played in the attacking third, a quick read on territory.
- PPDA counts opposition passes per defensive action; a lower number usually means a more intense press.
The scoreline tells you who won, but it rarely tells you why. Over the years I have found that three numbers, read together, explain most matches better than a page of statistics. In this guide I will show you how I use expected goals, field tilt and PPDA to break down a game, and where each one can mislead you.
A note on the example
To show the method, I am going to use an illustrative match between Team A and Team B. The numbers are made up to show the method; they do not come from any real game. I have chosen them because they tell a story that comes up again and again in real football.
Here is the summary. Team A won 1–0.
| Illustrative numbers | Team A | Team B |
|---|---|---|
| Goals | 1 | 0 |
| Shots | 17 | 6 |
| Expected goals (xG) | 1.1 | 1.7 |
| xG per shot | 0.06 | 0.28 |
| Final-third passes | 140 | 60 |
| Field tilt | 70% | 30% |
| PPDA | 7 | 15 |
At first glance, Team A look like deserved winners. They had nearly three times as many shots and most of the ball in dangerous areas. By the end of this guide, I hope you will see why I would not be so sure.
Expected goals: how good were the chances?
Expected goals, or xG, is a way of rating each shot by how likely it is to be scored. A model looks at thousands of past shots with similar features and asks how often shots like this one went in. If shots like it were scored about one time in ten, the shot is worth 0.1 xG.
When I build my own models at weekends, the main inputs are simple. How far from goal was the shot? What was the angle? Was it a header or a kick? Did it come from a cross, a through ball or a rebound? Was it a set piece? Each of these changes the odds, and the model combines them into one number between 0 and 1.
A team’s xG for the match is just the total of all its shots. So 1.7 xG means that, if those exact chances were played out many times, you would expect them to produce about 1.7 goals on average. It is not a prediction of the score. It is a measure of how good the chances were.
Why quality beats quantity
This is where the shot map in Figure 1 earns its place. Both teams’ shots are shown attacking the same goal so you can compare them. Each circle is one shot, and the bigger the circle, the higher its xG.
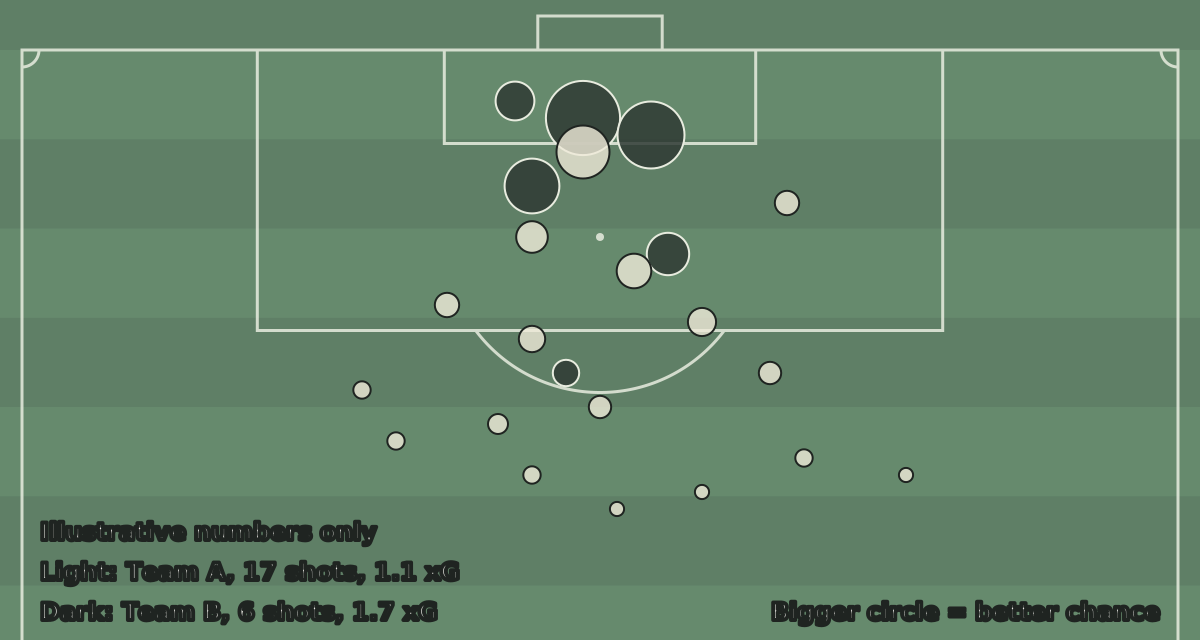
Figure 1: An illustrative shot map. Team A’s light circles are many and small, mostly from outside the box. Team B’s dark circles are few and large, clustered around the six-yard box.
Look at where Team A’s shots came from. Most of the light circles in Figure 1 sit outside the penalty area, and they are tiny. Long shots are hard to score, so each one carries a small xG. Seventeen of them added up to only 1.1.
Now look at Team B’s dark circles. There are only six, but most are inside or close to the six-yard box. Two of them are big enough to be closer to a coin flip than a long shot. Those six chances added up to 1.7 xG, more than Team A’s seventeen.
That is the main lesson of xG. A shot count treats a speculative effort from 30 yards the same as a tap-in. xG does not. In my illustrative match, Team A won the shot count comfortably and still created the weaker set of chances.
The limits of xG
xG is useful, but it has blind spots, and I check for them every time.
Most models do not know who is shooting. A chance falling to a top striker is rated the same as one falling to a full-back. They also usually do not know how many defenders were in the way, or whether the goalkeeper was out of position, unless the model has been built to include that.
Different models also give different values for the same shot, because they are built on different data with different inputs. So I never compare one model’s xG with another’s.
Finally, one match is a very small sample. A team can create the better chances and lose, as Team B did in my example. xG becomes far more reliable over many matches than over one.
Opinion: I treat a single match’s xG as a good question rather than an answer. It tells me where to look in the footage, not what to conclude.
Field tilt: who had the territory?
Possession tells you who had the ball, but not where. A team can have plenty of the ball while passing it sideways across their own back line. Field tilt is a simple way to measure territory instead.
To work it out, I count each team’s passes in their attacking third of the pitch. Then I take each team’s share of the total. In the illustrative match, Team A played 140 passes in the final third and Team B played 60. That gives Team A a field tilt of 140 out of 200, or 70%.
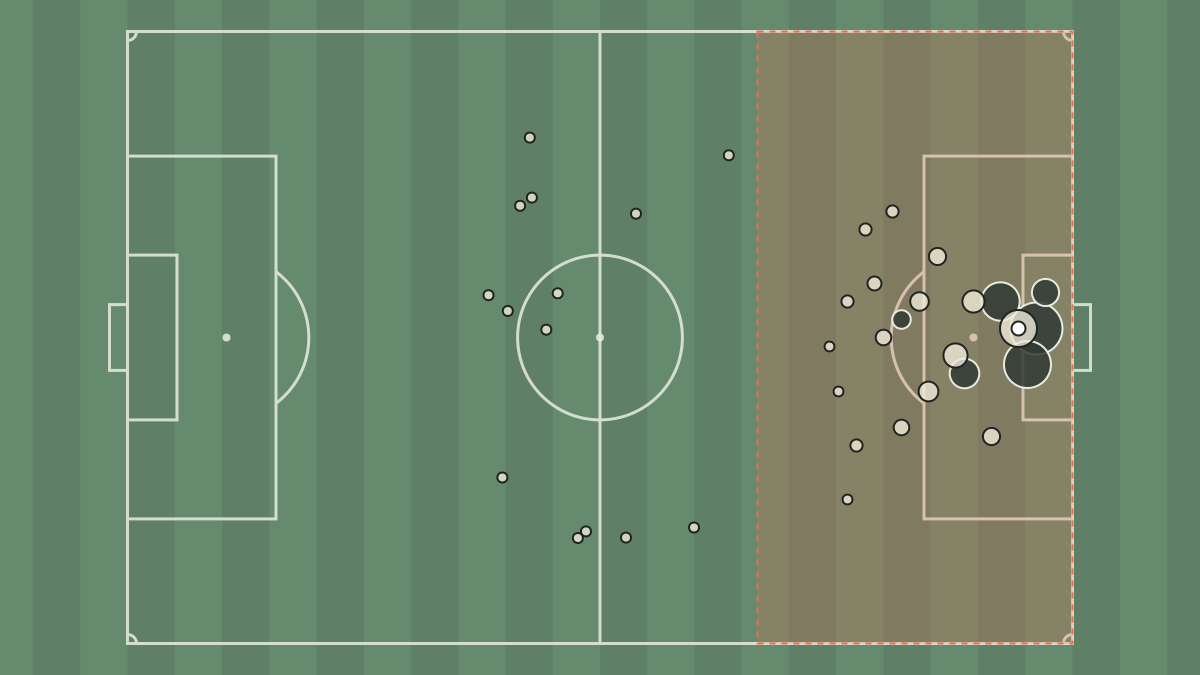
Figure 2 shows what that looks like. The shaded areas are the two final thirds. Each light dot on the right represents Team A’s passes in their attacking third, and each dark dot on the left represents Team B’s, scaled down so the ratio is easy to see.
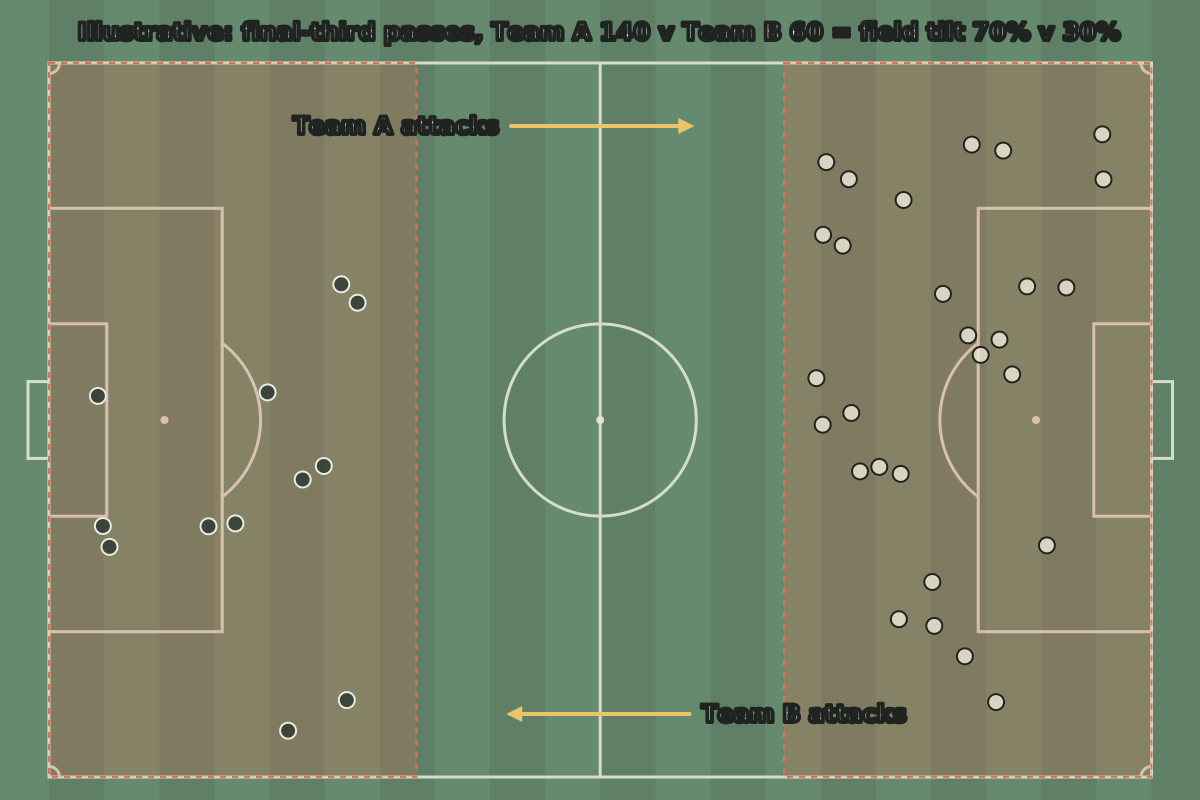
Figure 2: An illustrative field-tilt picture. Team A attack right and Team B attack left. Most of the activity happens in Team A’s attacking third, which is what a 70% field tilt means.
Field tilt is good at showing which team spent the match camped in the other’s half. In Figure 2, the picture is lopsided. Team A were pinning Team B back for long spells.
The limits of field tilt
The problem is that territory is not the same as danger. Put Figure 1 next to Figure 2 and you see the gap. Team A had most of the ball near Team B’s box, but they kept shooting from distance because they could not find a way through.
Field tilt also cannot tell you whether a team was pushed back or chose to sit deep. A side protecting a lead, or one built to counter-attack, may be happy to give up territory. A low field tilt for them is a plan, not a failure.
It also depends on where you draw the line. Some analysts use the final third and others use a different zone, so the numbers are only comparable if the method is the same.
PPDA: how hard did they press?
PPDA stands for passes per defensive action. It is a rough measure of how aggressively a team presses when they do not have the ball.
The idea is simple. In the part of the pitch where a team presses, usually the opposition’s half and a bit more, I count how many passes the opposition complete. Then I divide by the number of defensive actions the pressing team makes there, such as tackles, interceptions, challenges and fouls.
A low number means the opposition were allowed only a few passes before someone tried to win the ball back. A high number means the opposition could pass for longer without being challenged.
In my illustrative match, Team A had a PPDA of 7 and Team B had 15. Team A pressed high and often. Team B mostly dropped off and let Team A have the ball. That fits with the field tilt: Team A won the ball back high, so they spent more time in the final third.
The limits of PPDA
PPDA counts actions, not pressure. A team can close down every pass quickly without ever making a tackle, and PPDA will barely notice. The pressure was real, but the number does not see it.
It also depends on the opponent. If a team faces a side who kick it long from the back, there are very few passes in the pressing zone to count, and the number can swing a lot.
Finally, like field tilt, the exact zone and the list of actions that count can vary. I always check how a PPDA figure was worked out before I compare it with another.
Putting the three together
The value comes from reading the numbers side by side. Each one answers a different question. Field tilt asks who had the territory. PPDA asks how hard each team worked to win the ball back. xG asks who created the better chances.
In the illustrative match, the story goes like this. Team A pressed hard, won the ball high and spent most of the match in Team B’s third. But Team B defended their box well and forced Team A into long shots. When Team B did break, they created a few very good chances and missed them.
Opinion: If I saw these numbers from a real match, I would say Team B were unlucky not to get something, but also that their approach was risky. Relying on a handful of big chances means a couple of misses can cost you the game, as it did here.
That is the kind of conclusion I trust most. It is backed by the numbers, but it still leaves room for what the footage shows. Numbers are a lens, not a verdict. The next time you read a match report, try asking these three questions before you look at the scoreline. You may find the scoreline makes a lot more sense.
Every tactical claim on Pressing Matters is backed by match footage or published data, cited with the match and date. Opinion is labelled as opinion. Spotted a mistake? Tell us and we will correct it at the end of the article.
Written by
Niamh Doherty
A Belfast data analyst who builds her own expected-goals models at weekends and checks every number twice.
More from Niamh Doherty